detangle: Dependency rules for JavaScript, checked in under a second
I built detangle, a Rust tool that checks import cycles and architecture rules on VS Code's source in 0.18 s. Here is how it was measured, how I checked it's correct, and the new ESLint rules.
A forbidden import is cheapest to fix in the minute you write it. On most JavaScript teams it's found much later: in CI, if a dependency rule runs there at all, or months on, when a refactor stalls on a tangle of files that all import each other. The tools that check these rules exist, but on a big codebase they're slow enough that nobody runs them while working. ESLint's import/no-cycle took 4.8 minutes on VS Code's source when I measured it.
So I built detangle: dependency analysis and architecture rules for JavaScript and TypeScript, written in Rust on top of the oxc parser and resolver. It checks VS Code's src/ (10,118 modules, 113,342 imports) in 0.18 s. Version 0.2 adds ESLint rules backed by a native add-on, so the same checks show up in your editor as you type.
It can take over dependency checks from tools such as dependency-cruiser, madge and ESLint's import rules, while complementing ESLint's other checks and TypeScript's type checker. The rules and resolution behavior differ, so compare the findings on your project before replacing an existing check.
What it does
detangle scans a project, builds its import graph and checks rules against it. With no config, detangle check reports import cycles, imports that don't resolve, npm packages you import without declaring, devDependencies imported by production code, production code importing test files, and orphaned files. Your own rules go in detangle.toml, as regular expressions over paths relative to the project root:
# features may not import each other
[[forbidden]]
name = "no-cross-feature"
severity = "error"
from = { path = '^src/features/([^/]+)/' }
to = { path = '^src/features/', path_not = '^src/features/$1/' }
Rules can also cover dead files, npm licenses, runtime-only cycles, folders as a whole, and groups such as Nx projects.
npm install --save-dev detangle
npx detangle check            # run the rules; exits 1 on errors
npx detangle check -f github  # in CI: annotations on the pull request
Explore the graph in your terminal
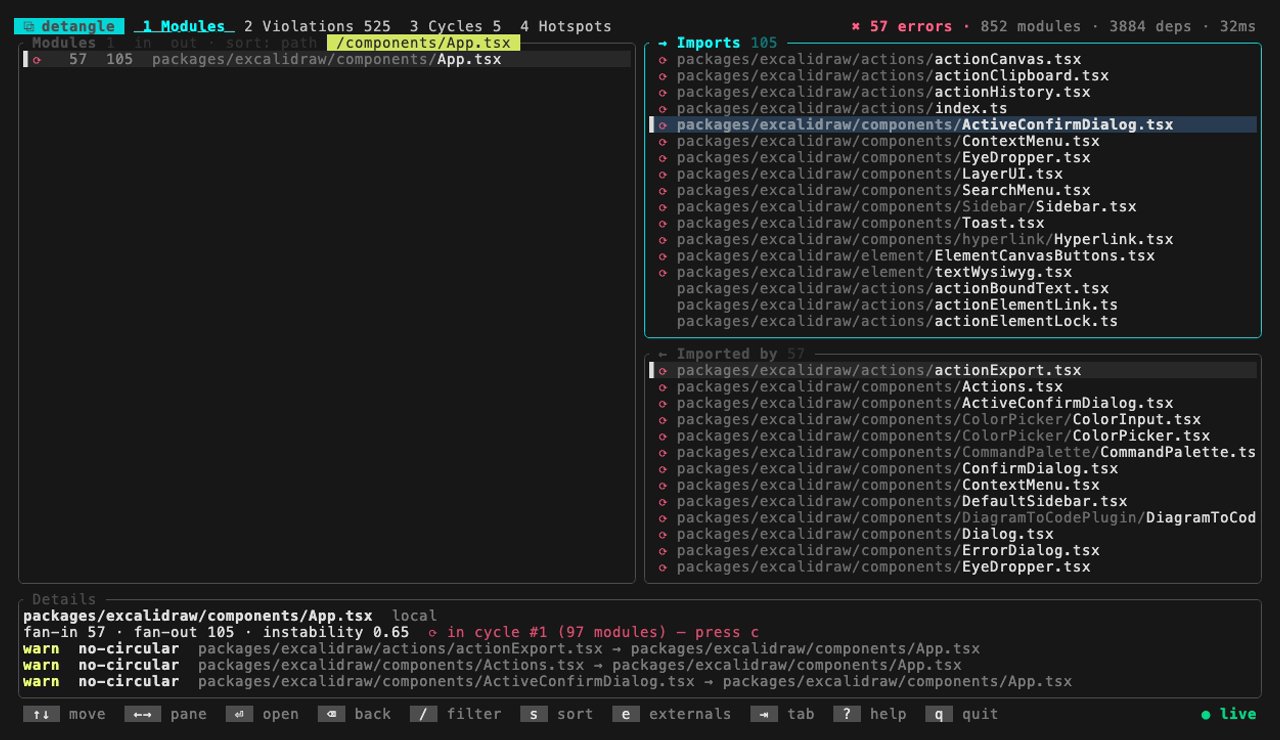
Run npx detangle with no arguments to open the interactive explorer. Pick a module to see its imports and importers, follow the cycle it belongs to, or inspect the project's violations and hotspots. The graph rebuilds as you edit, so you can trace a dependency before deciding how to untangle it.
The numbers, and how they were measured
Each tool checks the same repository, at a pinned commit, for the problems it's built to find: detangle its default rules, dependency-cruiser cycles, orphans and unresolvable imports, madge cycles (--circular), and ESLint import/no-cycle (eslint-plugin-import 2.32, default options, so no maxDepth limit) with the TypeScript resolver, on one thread, ESLint's default.
| VS Code `src/` | Wall time (median) | Peak memory |
|---|---|---|
| detangle | 0.18 s | 156 MB |
| detangle (cached) | 84 ms | 113 MB |
| dependency-cruiser | 35 s | 4.6 GB |
| dependency-cruiser (cached) | 1.12 s | 824 MB |
madge --circular | 34 s | 704 MB |
ESLint import/no-cycle (1 run) | 289 s | 2.6 GB |
| Excalidraw | Wall time (median) | Peak memory |
|---|---|---|
| detangle | 23 ms | 41 MB |
| detangle (cached) | 18 ms | 24 MB |
| dependency-cruiser | 1.69 s | 572 MB |
| dependency-cruiser (cached) | 0.44 s | 284 MB |
madge --circular | 2.88 s | 588 MB |
ESLint import/no-cycle | 9.18 s | 777 MB |
Measured on October 2, 2026, using detangle 0.2.1 on an Apple M3 Pro (12 cores, 36 GB, macOS), with background apps paused. Peak memory is the median of each run's maximum resident set size reported by /usr/bin/time (one sample for ESLint on VS Code).
- Every run is a fresh process after one warm-up run; the medians are of 30 runs for detangle, 5 for dependency-cruiser, 3 for madge and ESLint, and a single ESLint run on VS Code, which takes minutes.
- "Cached" means the tool's own cache was warm and nothing had changed.
- detangle is timed as its native binary;
npx detangleadds the startup of a small Node.js launcher, about 25 ms here. - The tools don't do identical work, but detangle's time barely depends on it: with its default rules, with only cycles (type-only imports counted), or with exactly dependency-cruiser's checks here, it takes 0.18 s on VS Code.
Your numbers will differ with your machine, and a laptop busy with other work moves detangle's sub-second times the most. The harness is public: detangle-bench clones the repositories, installs pinned versions of every tool and prints this table.
Fast is only interesting if it's right
The first thing I checked was whether detangle and dependency-cruiser agree on which imports are part of a cycle, not just how many. At first they didn't, by hundreds of imports, and it took a while to see why. detangle by default leaves out cycles that only close through import type, because type-only imports disappear at compile time and can't create a cycle at runtime (set cycles_ignore_type_only = false in detangle.toml to include them). dependency-cruiser, set up to follow TypeScript's pre-compilation dependencies, counts them.
For ordinary cycle checks, detangle uses Tarjan's algorithm to find strongly connected components: groups in which every module can reach every other. It marks imports within those groups as circular, including self-imports, and uses breadth-first search to find a shortest cycle to show in a diagnostic. It doesn't enumerate every possible cycle, which would become costly as a graph gets denser. Rules with via or via_only constraints need additional searches for cycles that meet those conditions. The traversal is recursive, so this isn't a guarantee for arbitrarily deep import chains.
Compared like for like, with type-only imports counted on both sides, detangle reports every import that dependency-cruiser reports on a cycle, on both repositories. It also reports more: 642 on VS Code and 476 on Excalidraw. Each of those is on a cycle in dependency-cruiser's own dependency graph. On Excalidraw, it flags 271 of them as circular in its output but leaves them out of its list of violations, where another import on the same cycle is listed. For the other 205, its graph has the cycle but doesn't mark that import. One of them is a plain runtime cycle across two packages: packages/math/src/range.ts imports @excalidraw/common, whose index re-exports colors.ts, which imports clamp from @excalidraw/math, whose index re-exports range.ts. dependency-cruiser marks the other three imports on that loop as circular, but not the first. The parity script reruns this comparison import by import.
For the configurations detangle migrate converts (ESLint import rules, Nx module boundaries and eslint-plugin-boundaries), I checked on test projects I built to exercise their options that the converted config reports the same violations as the original tool. That check isn't reproducible from the bench repository yet; the results are in the reference, and making them reproducible is next.
Where the time goes
There's no single trick. On VS Code, about 155 ms of the run is the scan: walking the directory tree, parsing every file and resolving every import. detangle does all three in one parallel pass, so each file is parsed by the thread that found it while the walk continues, and resolution results are shared across files in the same directory, which tend to import the same things. oxc does the parsing and module resolution, and it is very fast at both. Building the graph and evaluating the rules take about 20 ms more.
A few smaller decisions add up: a compact parse cache keyed on file timestamps (--cache), so an unchanged file isn't parsed again; mimalloc instead of the system allocator, which matters with many threads allocating at once; and not freeing the graph at all when a one-shot command exits, since the operating system reclaims it faster than freeing it piece by piece.
In your editor (experimental)
The ESLint rules are the part I'm most curious about. An ESLint rule has to answer synchronously, inside a process that may live for hours, so spawning the CLI for each file would cost the whole scan every time. Instead detangle/eslint loads a native add-on, built with napi-rs and running inside the ESLint process, that keeps the project in memory, follows saved changes with a file watcher, and treats the buffer you're editing as the file's contents. An edit re-parses only that file, so an import you've typed but not saved is checked straight away.
// eslint.config.js (ESLint 9 or 10)
import detangle from "detangle/eslint";

export default [/* ...your config */ detangle.configs.recommended];
Violations show on the import that causes them, including cycles and folder rules. On VS Code, the first lint scans the project in about 0.2 s; after that, a lint adds 0.16 ms for a typical unchanged file and about 20 ms after an edit that changes its imports.
Each ESLint process (or --concurrency worker) retains its own copy of the project. On the benchmark Mac, opening the native project increased RSS by about 1.1 times the CLI's peak RSS, excluding memory already used by Node and ESLint. More workers therefore mean more copies and more memory. When an edit changes the result for another file, say by closing a cycle through it, that file's warnings update the next time the editor lints it. It's marked experimental because it's new, and the reference lists what it doesn't do yet. Keep detangle check in CI regardless: eslint --cache can't know that a file's result depends on other files.
Coming from another tool
detangle migrate converts what you already have into a detangle.toml: dependency-cruiser configs, ESLint import rules such as import/no-cycle and no-restricted-paths, Nx module boundaries, eslint-plugin-boundaries and madge. It refuses to overwrite an existing config unless you pass --force.
npx detangle migrate --dry-run   # preview
npx detangle migrate             # write detangle.toml
Adopt it without fixing everything first
Compare detangle's findings with your existing checks before recording a baseline. On a codebase with existing violations, record today's findings, then commit the baseline file and use it in CI:
npx detangle check --write-baseline .detangle-baseline.json  # record today's findings
npx detangle check --baseline .detangle-baseline.json        # use the committed baseline in CI
Findings that match the baseline are accounted for; new error-level violations fail the check. You can fix the backlog gradually while keeping it from growing.
What it doesn't do
- It isn't a type checker. It follows imports the way bundlers and Node resolve them, through tsconfig paths, package
exports, workspaces, Yarn PnP and Vite or webpack aliases, but it doesn't evaluate types. - Resolution has edge cases. detangle resolves a workspace's unbuilt packages into their sources, and on Excalidraw it agrees with dependency-cruiser on all but one of 26 unresolvable imports:
setupTests.tsimports the repository's own@excalidraw/commonpackage, which isn't built, and the file sits outside the tsconfig that maps that package to its sources. dependency-cruiser resolves it and detangle doesn't. Report resolution edge cases in Issues. - The ESLint rules are experimental and new in 0.2. The add-on is prebuilt for macOS, Linux (glibc and musl) and Windows, on x64 and arm64, and tested on Linux, macOS and Windows, but not yet across many editors and projects.
- The benchmark numbers come from one Mac. The harness supports macOS and Linux and relies on
/usr/bin/time; it does not run natively on Windows. Numbers from other machines are welcome.
Try it
detangle is MIT or Apache-2.0, on npm, crates.io and Homebrew (brew install debug-diary-1/tap/detangle). If you run it on your codebase, I'd like to know how long it took and whether it found what you expected; the issues are open.
Read next
Launching vizcrush: Three Beliefs My Benchmarks Killed
vizcrush launched with its three loudest performance claims deleted. What measuring WASM SIMD, cross-engine WASM, and WebGPU compute actually showed.
13 min read
We Benchmarked JS vs Wasm for WebGL: Here's What Actually Matters
A benchmark-driven comparison of JavaScript vs WebAssembly for WebGL workloads. We tested particle systems, mesh generation, and physics simulation across 1K to 1M elements. The results were not what we expected.
17 min read
AetherUI: From Component Library to Public Release
I published AetherUI, a headless Web Component library with 25 core components and a validated path for agent-generated UI. Here is what the launch made me solve.
6 min read